Thursday, March 31, 2011

Market Updates for 31-Mar-2011

Nifty as on 30th March 2011
KST

KST lines failed to cross in lower zone (oversold zone) and seen buying in last few min and now both indicators are above base line and trading at over bought zone indicates market may trade stable but due to expiry day market may trade volatile

India VIX
Open High Low Current Prev Close % Change
21.2222.1419.9522.0421.223.86

fear index is again gained little power indicates volatility continues and may develop selling if it reached 23-24 at higher levels..


[edit]

Tuesday, March 29, 2011

Updates for 30-Mar-2011

updates shortly
KST


India VIX

Open High Low Current Prev Close % Change
21.02 22.19 20.37 21.22 21.02 0.95


Pivot

Pivot  S3 S2 S1 Pivot R1 R2 R3
Nifty-50 5611.6 5653.4 5704.2 5746 5796.8 5838.6 5889.4


[edit]

Market Updates for 29-Mar-2011

KST
updates shortly


INDIA Vix
Open High Low Current Prev Close % Change
20.4721.8720.2421.0220.47 2.69

Indian Volatility Index closed at 21.02 up by 2.69%, even in positive trend indicates volatility is building due to expiry week VIX reaching towards 22-23 indicates selling is building at higher level.


Pivot


S 2 S 1 Pivot R 1 R 2
5613.9 5650.5 5679.8 5716.4 5745.7

Nifty closed at 5687.25  above pivot and near to pivot short term target of 5716.4 is important for upside move if nifty fails to reach 5716 may lead to downwards for 5650.5, If we look at option data all put options are trading below averages and call options are trading above averages and Nifty future is now trading above Averages indicating strong move. But due to expiry week we have to book profit at higher level and wait for re-enter at lower levels.

Sunday, March 27, 2011

MARKET UPDATES FOR MORNING

28-Mar-2011 (updates within hour)
KST


KST Indicators crossed at higher bought zone now looking towards baseline indicates Nifty may face selling at higher levels in morning.

India VIX
Open High Low Current Prev Close % Change
19.8420.6819.0020.4719.84 3.18

India VIX is now again trying to cross 21 indicates market may face selling if it crosses 22 


Pivot
Pivot  S3 S2 S1 Pivot R1 R2 R3
Nifty-50 5477.1 5524.1 5599 5646 5720.9 5767.9 5842.8


[edit]

Thursday, March 24, 2011

Trader Guide

KST


KST indicators crossed in oversold zone and trading near baseline and trying to trade above baseline indicates market remains strong.


Pivot

S 2 S 1 Pivot R 1 R 2
5482.9 5502.6 5515.8 5535.5 5548.7

Nifty Closed at 5522.40 above pivot point buy for 5535 and sell for 5502, If we look at futures nifty Futures trading above averages5550.70 (Avg. Price 5532.41) indicates volatility continues if nifty loose some points in morning other wise good for longs, If we look at near month option data  call options closed above Averages price and Put Option Closed below Averages indicates market is now in strong positions and looking good for investment.


India VIX

Open High Low Current Prev Close % Change
20.9720.9718.8319.8420.97 -5.39

 India VIX closed at 19.84 down by -5.39% indicating market is stable and if again trades below 18  market may face selling at higher level.


[edit]

Wednesday, March 23, 2011

Trader Guide for 24-Mar-2011

updates shortly
KST


If we look at KST Charts Indicators remains in upper zone and if cross happens in morning it may be chance for booking profit.


PIVOT

S 2 S 1 Pivot R 1 R 2
5372.7 5426.4 5455.7 5509.4 5538.7
Nifty Spot closed at 5480.25 above pivot point and near resistance indicates market remains strong in morning and trade volatile if it trades below 5455


INDIA VIX

Open High Low Current Prev Close % Change
22.2622.3720.9720.9722.26-5.80

India VIX again lost some points as Nifty gains 2nd day in row indicates Nifty looking Strong at the momentum but but trading below 18 and trading above 24 is turning point for market trend.

Nifty Futures trading above Averages (+24.44) and if we look at option data near month Put options are trading below averages and call options trading above averages. good for booking profit at higher levels and need to watch decrement of price due near term expiry open interest reductions and additions will lead to volatile situation...


.

Tuesday, March 22, 2011

Trader Guide for 23-Mar-2011

UPDATES SHORTLY
KST


INDIA VIX
Open High Low Current Prev Close % Change
25.2125.2122.1822.2625.21-11.70


PIVOT
Pivot  S3 S2 S1 Pivot R1 R2 R3
Nifty-50 5331.9 5354 5383.9 5406 5435.9 5458 5487.9


[EDIT]

Trader Guide for 22-MAR-2011

KST


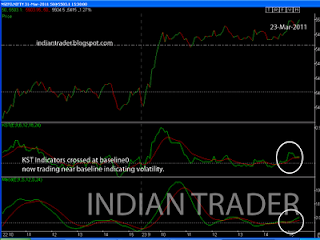
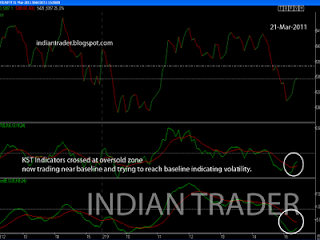
Kst Indicators crossed at oversold zone and trying to trade near base line suggesting volatility remains in market.


INDIA VIX

Open High Low Current Prev Close % Change
25.8926.5923.6925.2125.89 -2.63

India VIX lost 2.63% and remains 25.21 its a short term worry for bulls  may Nifty Recovers if it reach and 24 and below and selling may build up if again trades above 25.5

PIVOT POINT


S 2 S 1 Pivot R 1 R 2
5310.2 5337.4 5375.4 5402.5 5440.5

Nifty Closed at 5364.75 below pivot suggesting volatile trade in Morning and panic leads to loss nifty Futures & Call options trading @ below Averages and Put Options Trading @ Above Averages suggesting possibilities of are high towards Shorts. Sell for 5337 and buy for 5402 if trading above pivot.

Monday, March 21, 2011

Trader Guide for 21-Mar-2011

KST
Updates Shortly...

INDIA VIX
Open High Low Current Prev Close % Change
25.2626.6023.2725.8925.26 2.49

India VIX Closed with gain of 2.49% indicating  volatility remains. sell on rise is indicated if again VIX reached 26 in morning

PIVOT POINT

S 2 S 1 Pivot R 1 R 2
5291.0 5332.3 5407.7 5449.0 5524.35
Nifty Closed at 5373.70 below pivot point point and needs 34 points to reach pivot and 41.4 points to reach Support 1 sell for 5332 and buy for 5449 Nifty Futures Trading Below Averages indicating sell on rise and if we look at option data Put Options Closed above Averages and Call Options closed below Averages indicating sell on rise.

Thursday, March 17, 2011

Trader Guide for 17-Mar-2011

KST


KST Indicators Crossed at over sold zone and reaching baseline indicating volatile trade in morning

INDIA VIX

Open High Low Current Prev Close % Change
24.8926.1123.4725.2624.891.49

India VIX is up by 1.49%  volatility indicated, if crossed 26+ again  may we face little trouble. sell on rise is indicated for intraday trade.

PIVOT


Pivot  S3 S2 S1 Pivot R1 R2 R3
Nifty-50 5343.2 5389.2 5417.9 5463.9 5492.6 5538.6 5567.3

Nifty Closed at 5446.65 marginally above pivot needs 46 points to reach Resistance 1 and needs 28.7 points to reach Support 1 sell for 5417 buy for 5492.  Nifty Futures closed below averages indicating there is a selling pressure but if we look at option data call options closed below averages and put options closed marginally below averages expect 5500 put, 5500 put marginally above from averages.

[Edit]

Trader Guide for 17-Mar-2011

KST


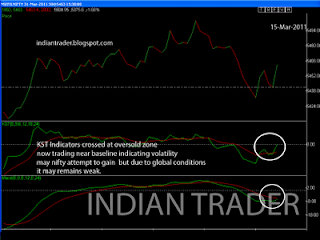
KST indicators crossed in oversold zone and now trading near base line indicates volatility continues in morning trade.


PIVOT

Pivot  S3 S2 S1 Pivot R1 R2 R3
Nifty-50 5420.4 5448.1 5479.6 5507.3 5538.8 5566.5 5598

 Nifty Closed at  5511.15 above Pivot Point and Previous Resistance need 27.7 points to reach Resistance 1 and need to loose 3.8 reach Pivot market remains buy for 5538.8 and sell below 5479

INDIA VIX

Open High Low Current Prev Close % Change
26.6326.6324.1424.8926.63-6.53

India VIX is is at 24.89 near days low indicates market remains volatile and try to remain positive, VIX if again crosses 25.5+ market may under selling pressure other wise good for positive trend

Tuesday, March 15, 2011

Trader Guide for 16-Mar-2011

KST

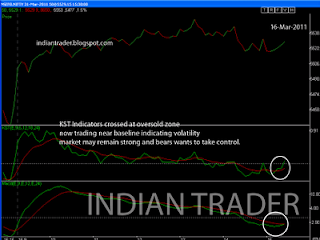
If we look at KST charts both lines are in over sold zone and bulls may struggle to gain.


INDIA VIX
Open High Low Current Prev Close % Change
23.3027.5223.3026.6323.3014.29

India VIX is up by 14.29%  indicating near term market may remain weak and we may face selling pressure at higher level.


PIVOT TABLE

Pivot  S3 S2 S1 Pivot R1 R2 R3
Nifty-50 5258.6 5316.1 5382.8 5440.3 5507.0 5564.5 5631.2

Nifty closed 5449.65 above pivot point need 57.65 points to reach Resistance 1 and need to loose 66.85 points to reach support 1 if we look at Nifty options call options are trading above averages and put options trading below averages indicating bull sentiments in morning. volatility expected and market may remains flat if global cues deals well.

[Edit]

Monday, March 14, 2011

Trader Guide for 15-Mar-2011

KST


from 15-Mar-2011 
charts available soon.... keep visiting....


INDIA VIX
Open High Low Current P. Close % Change
24.1324.6423.0723.3024.13 -3.44


VIX index closed at 23.30 down by -3.44 suggesting market remains Positive to Volatile & Attempt Selling if VIX reached 24 and trades above 24.13


PIVOT TABLE
 
S 2 S 1 Pivot R 1 R 2
5397.95      5464.7      5501      5567.75      5604.05
Nifty closed at 5531.50 above pivot and near to Resistance 1 suggesting market may remain volatile buy for 5567 and sell for 5464. Nifty futures trading above weighted averages suggesting positive trend and global cues may affect market sentiments and depend on currency derivatives.

Friday, March 11, 2011

Trader Guide for 14-Mar-2011

UPDATES SHORTLY


PAGE IS UNDER CONSTRUCTION : 13-MAR-2011


KST 
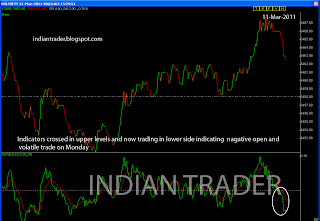
Both indicators are below 0 line and shortly reaching higher sold zone indicating negative trend and volatile trend in morning


 INDIA VIX

Open High Low Current Prev Close % Change
23.5325.2222.8724.1323.532.55

INDIA VIX  is up by 2.55% indicating volatility and suggesting sell on rise book profit at lower level re enter at higher


 PIVOT TABLE
S 2S 1PivotR 1R 2
5361.50          5403.40          5453.05         5494.95         5544.60


if we look at pivot points nifty closed at 5445.45 below pivot point need 7.6 points to reach pivot and need to loose -42.05 points to reach support 1 volatility expected on Monday.

Trader Guide for 11-Mar-2011

KST Updates for 11-Mar-2011


If we Look at charts both lines of  KST indicators are at higher bought zone and crossed indicating volatility and flat trend in morning and sell is suggested if nifty gains in morning for intraday trade


Pivot Table
S 2S 1PivotR 1R 2
5445.20      5469.80    5493.05    5517.65   5540.90


Nifty closed at 5494.40 near to pivot point indicating volatile trading.


India VIX

Open High Low Current Prev Close % Change
23.2824.1722.6323.5323.281.07


If we look at VIX data its clear market Nifty may attempt downward movement and trade volatile if VIX again reached 24.17+  we may face fresh selling pressure and it is good for intraday trade.


Wednesday, March 9, 2011

Trader Guide for 10-MAR-2011

KST Updates for 10-Mar-2011


If we Look at charts both lines of  KST indicators are in range of 0 Zone indicating volatility and negative trend in morning and nifty falls below and trading below 5530 may be sell indication for short term trade. if Nifty tries to maintain or stay above 5530-5535 will be short term positivity in Market but

Pivot Table
S 2S 1PivotR 1R 2
     5438.00       5484.45     5523.90     5570.30     5609.75

nifty closed at  5531.00 above  Pivot point (+7.0) & near to pivot point suggesting up move in morning if nifty unable to managed to stay above pivot its small term trouble for bulls and nifty will try to reach 5484.

India VIX

Open High Low Current Prev Close % Change
23.6724.2322.4623.2823.67-1.65

India VIX maintained to close below 24 if again reaches today's day high of 24.23 and trade above 24 we may see fresh selling opportunities on tomorrow for Intraday otherwise its a good time for invest and stay on long side.But all call options options ranges between 5400, 5500 & 5600 closed below average prices and put option ranges between 5500 & 5400 and 5300 closed below average prices indicating a heavy volatility in near term.

[edit]

Tuesday, March 8, 2011

MARKET UPDATES FOR MORNING

TRADER GUIDE FOR 09-MAR-2011 


Nifty Futures closed in upper side and closed at  5537.15 up by 61.55 points and above average price of 5521.42 KST indicators trading in upper level may be short term worry for shorts and crude oil price may still little worry but as for now oil price coming down and global markets trading in green after crude oil price seen some down side.

Pivot Table
S 2S 1PivotR 1R 2
5439.55        5480.15             5505.35      5545.95        5571.15 

Nifty Closed at 5520.80 near to pivot(+15.45 Points) and need 25.15 points resistance 1 indicating possibilities of upwards and if nifty fails to hold above 5505 it will be 1st selling signal for the day.

  India VIX
Open High Low Current Prev Close % Change
25.2225.2223.6323.6725.22-6.15

 India VIX maintained to close below 24 if its again look forward about its previous close we may see fresh selling opportunities on tomorrow

Saturday, March 5, 2011

Basic Trade Theory

 Hello everyone due to work load I am here with Basic Trade Theory using charts and KST (Know Sure Thing) I used this when I was new to KST may this help you. Just watch the movement which helps you to trade using KST many people said KST is well used for long period but from last few months I found this theory good for intraday and all of you want to know how it works. But This BASIC THEORY NEEDS PAPER TRADING so I suggest to Trade on Paper (Paper Trade)

now look at Image  
A. KST indicator is in the overbought area but the indicator crossed and is going down, this means that the downward momentum is gaining strength sell is indicated
B. Distance between indicator suggesting no near term possibilities of positive change.
 

C. Indicators reached Oversold Zone, right time for profit booking
D. Indicators staying in Oversold Zone,Positive cross happens now and time for going long 
E. Indicators trying another cross and cross is at 0 line and due to gap and 0 line volatility expected in this case try to book profit. wait for next sign. 

Simple Rules to follow Know Sure Thing ( KST ) as a Beginner

Rules for Longs
BUY at cross which happens at higher sold zone and SELL (book profit) at another cross which happens at higher bought zone


Rules for Shorts

SELL at cross which happens at higher bought zone and BUY (book profit) at another cross which happens at higher sold zone.

Thursday, March 3, 2011

F & O Trading Rules for Options

On Trading Day (1st Day)
Keep in Mind you are
Trading for the Day,
something goes wrong & not getting profit and and getting loss try to cover them don't try to average
If unable close your position till day end

Next Day (2nd Day)
Try for minimum Profit or marginal loss
Still not able to close

3rd Day
try for Minimum Loss
Still not able to close
forget Lot and try new one

From 4th day
don't do the same mistake again & try new one

Wednesday, March 2, 2011

Speak by Indian Trader

This blog is for those who requested me for a blog about trade in market hours using KST Methods for Intraday and in reply now i started this new blog for members from Just Nifty and people who want learn KST (Know Sure Thing) and possibility of profits in intraday methods. But you all may have to wait  small period.... 

Keep Visiting
Regards
IT