Wednesday, November 30, 2011

Intraday Update 29-Nov-11 - Nifty

Buy above 4810 NS, SL 4790 target 4850-4870-4910

Sell Below 4805 SL 4820 Target 4760-4710

Trader Guide for 30-Nov-2011

KST
Nifty Futures 5 min


Nifty Futures 60 min


Nifty Futures EOD


Pivot


India VIX


Nifty Futures closed at 4812.00 below pivot and averages indicates market is still bearish and may tank few more points as said in yesterdays post Nifty need strong rally for gains now... it may test support zone of 4771 and 4731 and on upside it may try to reach 4868 and 4925 and selling and buy zones are 4838 and 4785, India VIX closed with small gain (0.86%) till 21DMA protected bulls no need to worry about small gains and Stoch & RSI are in favour of Bulls and holding sell major harm is possible from 21DMA and 10DMA both are looking strong against Bulls by supporting Bears on VIX and now they are major supports any fall on VIX is protected till these Two EMAs and will act and try to protect fall on VIX index, no on Nifty as discussed on yesterdays post Hourly chart still holding sell and it continued today and now on hourly chart KST indicator trying to reach oversold zone and still on over bought zone so please avoid longs till it reaches oversold zone and on fresh buy cross on Oversold zone may gives us a chance to enter in longs.. On Daily chart again some movement is visible and looks like KST indicator again trying sell on Over sold zone its not good development for bulls if KST again holds sell here bulls may get trapped, avoid carrying position till clear trend is visible. All these factor saying nifty may trade volatile for next 2-3 days.

Tuesday, November 29, 2011

Buy Nifty above 4845 SL at 4830 Target 4865-4890-4910. Sell Nifty below 4830 SL at 4845 target 4805-4780-4745
All levels are spot basis.

Trader Guide for 29-Nov-2011

KST
Nifty Futures 5 min


Nifty Futures 60 min


Nifty Futures EOD


Pivot


India VIX


Nifty Futures closed at 4873 above pivot and averages indicating bulls getting active slowly and Nifty may try to test  resistance zones of 4915 and 4957 and downside it may try to take support from 4790 and 4707, India VIX closed with loss of 8-50% and now stoch is looking sell it may hold this time, 50DMA is now again Resistance VIX unable to hold it as Support showing that Bulls are now gaining power and now its a good sign for Market.. Nifty is highly oversold now. Nifty on hourly chart, KST Indicator reached overbought zone any cross here again brings short term correction and it again give us a chance to enter in longs, On EOD chart KST Indicator attempted buy cross and we may need to reverse our position once we get another buy cross on hourly zone, if daily holds  buy after small selling.... we may go long on ever dip after small confirmation....

Sunday, November 27, 2011

Trader Guide for 28-Nov-2011

KST
Nifty Futures 5 min


Nifty Futures 60 min


Nifty Futures EOD


Pivot


India VIX


Nifty Futures  Closed at 4707.30 below pivot and averages indicate again nifty may again try to test support zone of 4671 and 4634 and on upside nifty may move towards resistance of 4760 and 4814 and India VIX again closed with gains of 4.19% looks on downside built strong base and it may not brake easily and now again 50DMA working as support for VIX and combination of 10/21 DEMA tells it may continue its upward journey and if this continue like this nifty looks very weak and may not able to see strong gains, But still stoch is holding sell on over bought zone so bulls still have little hope here, On nifty, on Hourly Charts KST indicator is holding buy cross and gap down again leads to selling wait for clear trend here and now nifty looks very volatile here try to trade with strict Stop Loss on both side and main trend is sill saying sell on rise.. On Daily chart KST Indicator is still holding sell cross from overbought zone and now at oversold zone till sure buy cross here we may need to sell on every rise...

Thursday, November 24, 2011

Trader Guide for 25-Nov-2011

KST

Nifty Futures 5 min


Nifty Futures 60 min

 Nifty Futures EOD

 Pivot


  India VIX


Nifty Futures (December) Closed at 4777.25 and closed above pivot and averages on up side it may test 4831 and 4885 and sell attempt may possible from 4815 and on down side Nifty may test support of 4690 and 4603 and buy attempt may possible at 4738 today India VIX closed with loss of -8.90% and again failed to hold 50 DMA as support and now RSI attempted sell indicating little worries are waiting for bears, Stoch attempted cross on overbought zone and waiting for clear indication... Today as a result of expiry day nifty closed with gains and surprised bears and on Nifty hourly Charts KST Indicator is now holding buy cross on oversold zone trying to reach overbought zone carried longs need to close on fresh cross here and may try shorts if cross visible here and holds, on Daily chart small indication of up move is visible but it looks manageable for bear till visible fresh buy cross here wait for rise and sell on high...

Trader Guide for 24-Nov-2011

KST
Nifty Futures 5 min


Nifty Futures 60 min


Nifty Futures EOD


Pivot


India VIX


Nifty Futures closed at 4703.80 near pivot and below averages indicates market is very weak after gap down Nifty tried to gain but unable to close with strong gains and today India VIX again closed with huge gains of 12.18% indicates we are ready for high volatile end of this month, high volatility always supports bears and now  50 DMA acting as support on VIX,  if we note this all we may see bearish mood on market is visible, Nifty may try to take support from 4632 and 4561 on down side and upside may test resistance of 4774 and 4845 and selling may possible if Nifty reached resistance zone. On Nifty Charts, on Hourly Chart KST Indicator is holding buy it seems limited and may get erased if we see gap down in morning otherwise we may see small gains on Nifty, but here at this stage try to avoid long side trade, wait for rise and sell from high, it may be best trade idea now, On Daily chart KST Indicator is still on oversold zone and gaining strength on down side  and till now no sign of reversal is visible so we can sell on every rise...

Tuesday, November 22, 2011

Trading Plan of 23-Nov-11


Today NIFTY opened gap-up, despite of negative global cues, is more of technical reason. If we look at the price action, it stayed well within the yesterday’s closing price and yesterday’s high making inside day formation. It closes at 4812.35 which is Hourly 5 EMA but below daily pivot of 4816. Daily stochastic


Nifty Ahead: Although OI data is highly favouring bears, not breaching of 4775 may insure few points to bulls. Inside day formation and closing at lower band of Bollinger Band is supporting the view also; although candle stick pattern is not sufficient enough to analyzing direction specially in highly trending market. 4860-4870 looks like good resistance, so it may get sold off from there. Next resistance is 4890-4905. Before expiry day it can go for roller coaster journey.


Possible trade: I’d like to buy nifty above 4820 with SL at 4800 for target of 4860, 4890, 4930 and sell below 4760 for the target of 4720, 4675 with SL at 4790.

Trader Guide for 23-Nov-2011

KST
Nifty Futures 5 min


Nifty Futures 60 min


Nifty Futures EOD

 Pivot

India VIX


Nifty Futures closed at 4803.10 below pivot and averages indicates market is still weak after good start and now it may test and take support from 4769 and 4735 on down side and may reach resistance of 4848 and 4893 selling attempt by bear may be at 4824 and buying attempt may possible at 4781, today India VIX closed with loss of 4.40% on if we look at VIX chart VIX is failed to hold major resistance of 50 DMA and now Stoch is looking down and RSI too want to support weakness on VIX if all this events get full filled VIX may tank few more points from here and may again try to climb high from support of 10 DEMA and 21 DEMA, until this both moving averages holds VIX looks strong. MACD still on oversold zone and supporting up move on VIX, if we look at all this points Nifty looks very volatile and due to expiry, high volatile trades are common... On Nifty, After good start in morning bulls collected some food from market but failed to hold good gains looks very disappointing event for bulls. Now on charts on hourly chart now KST Indicator is again attempting sell on oversold zone. As we discussed on yesterdays post, buying in falling market is nothing but pure gamble. Wait for clear buy cross here to go long and use strict stop loss and respect stop loss if u got some points use trailing stop loss and protect capital and then think about profit.... On EOD chart KST Indicator is on oversold and still want to look on down side indicates bull may need to wait more as we say always "andhere ke baad savera jaroor aata hai"....

Monday, November 21, 2011

Trader Guide for 22-Nov-2011

KST
Nifty Futures 5 min


Nifty Futures 60 min


Nifty Futures EOD


Pivot

India VIX


Nifty Futures Closed at 4787.00 below pivot and averages looks nifty is on weaker side and may test support zone of 4744 and 4700 failing which it may test resistance of 4854 and 4921 and selling attempt may be from 4817 and bulls may try to buy attempt at 4756, India VIX again on gaining side and indicating more bearishness on Nifty, today India VIX Closed with 7.64% gains indicating huge volatility playing in market and now it may able to hold 50 DMA as support if gains continues and may lead to huge fall if it holds..... On Nifty charts now days looks like hourly chart need to ignore if we carry positions as we are playing roll of witness on continues gap downs and every gap down damaging small attempt of bulls and supporting bears... now on hourly chart KST Indicator is staying on oversold zone till fresh sure buy cross here every attempt of longs may looks like gamble and chances of loss are more as we taking positions against major trend.... if any cross holds here we may get 50-70 points sure.... on Daily chart day by day KST indicator is gaining strength on oversold zone and now looks like we may need strong rally to take some points from bears...  till sure buy cross here sell on every rise....

Trading plan for this week (21-Nov-11 to 25-Nov-11)


In weekly analysis of 14th Nov’11 my observation was, ”Nifty closed below 5 WEMA and 5 Weekly Moving Average touched 20 Weekly Moving Average. A convincing cross may give hope to bulls and NIFTY may recover some loosing ground. Failing to cross may cause fast fall. But NIFTY closed well below DLEMA (5200) and WHEMA (5280). These data are supporting bears now.” Nifty got down by almost 263 points or 5% in the week ended on 18th Nov’11 as bears were into the action for the whole week. Although there was some intraday bounce but those bounces were used as selling opportunity by bears. On Friday Nifty took support at 4838 and closed, above Monday’s Pivot of 4885, at 4905.
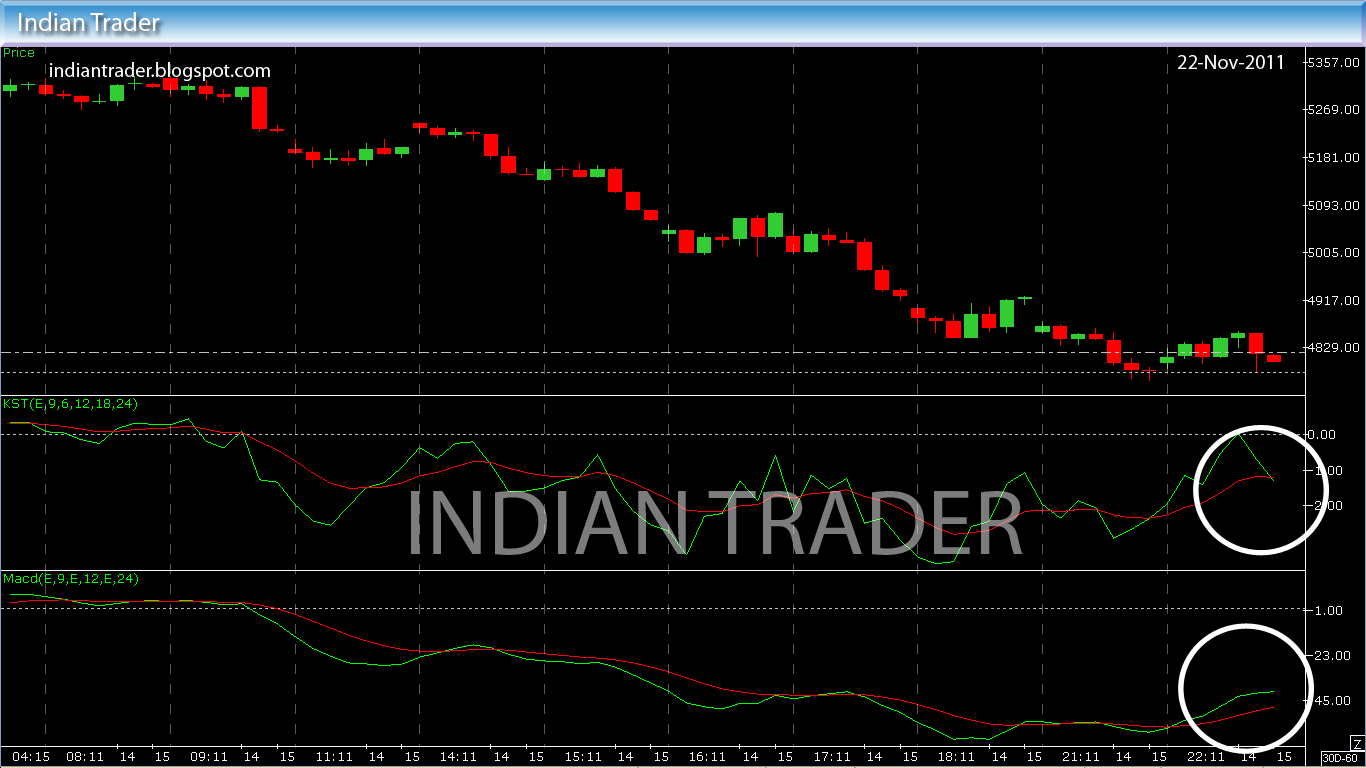

Daily Chart of NFTY


Nifty Ahead: For several days Nifty is trading in oversold zone and Friday’s closing at lower band of Bollinger Band makes it good candidate for buying at lower level. It may bounce and bulls may try to find some ground. Friday’s candle is a Doji with long tail which signal bullish reversal. But is nifty out of danger now? I think no. Weekly candle has shown no reversal pattern and there is a bearish cross appearing in Weekly MACD; although in daily chart, bullish cross visible in stochastic. This week is expiry week. Keeping all these in consideration it looks like Nifty will be highly volatile this week and there is upmove possibility in early part of the week which can be used as levels to sell by the bears. In a nutshell, both sides trading opportunity can be seen in Nifty.


Possible Trades : Buy Nifty above 4910 with SL at 4870 for target of 4970-5010. Staying above 5035 can target 5130-5180. Positional Long can be taken above 5035 with strict SL for the target of 5130-5180.

Downside movement seems limited in first two days of the week but any rally can be used as selling opportunity until there appears any sign of reversal. 4700 (-3% whipsaw) is strong support and highly probable also.

Trading levels, targets etc should be adjusted according to intraday trading setup.

N.B: All the above mentioned prices are based on Nifty spot Price.

Sunday, November 20, 2011

Trader Guide for 21-Nov-2011

KST
Nifty Futures 5 min


Nifty Futures 60 min


Nifty Futures EOD


Pivot


India VIX


Nifty Futures closed at 4923.15 above pivot and averages indicates market may try to reach Resistance of 4950 and 4977 and on lower side it may again try to take support from 4870 and 4818 and VIX closed with loss of 1.26% and failed to hold 50 DMA indicates little weakness and  Stoch is attempting sell on VIX if this happens VIX may tank few points from here and it may be 1st sign of weakness of bears... now on Nifty charts, on hourly chart KST Indicator is holding Buy cross on oversold zone it may reach over bought zone slowly this time, on Friday bears tried well to but unable to protect some points from bulls and now looks as bulls fighting for few points and may get some points if global supports gains... as per chart we need to close carried longs if KST Indicator reached overbought zone or get erased due to selling, until fresh cross visible overbought zone fresh shorts here looks pure gamble... on EOD chart KST Indicator is on oversold zone and any fresh gains again give us a chance to sell from high, wait for high and sell from high is main mantra of the day