Monday, October 31, 2011

Trader Guide for 01-Nov-2011

KST
Nifty Futures 5 min


Nifty Futures 60 min


Nifty Futures EOD

 Pivot
 
Nifty Futures closed at 5346.85 below pivot and averages 1st look supports bears, on chart...  now on hourly chart KST indicator is holding sell cross from overbought zone close carried short if buy cross is visible on oversold zone and wait for fresh buy cross on oversold zone for fresh longs... On daily chart KST Indicator is at over bought zone and till sure sell cross here every dip will give us a chance to enter in longs..... buy on dip continues....

Sunday, October 30, 2011

Trader Guide for 31-Oct-2011

KST
Nifty Futures 5 min
  Nifty Futures 60 min


Nifty Futures EOD


Pivot


Nifty Futures closed at 5384.50 above pivot and averages indicating gains are waiting on market if we look at charts now on Hourly chart KST Indicator is highly overbought and any cross here brings selling... need to close longs on highs or one can go short with Strict Stop-loss if cross is visible here.... on EOD chart KST Indicator is now at overbought zone and tell sure sell cross here any selling may give us a chance to enter in longs....  Buy on dips continues....

Thursday, October 27, 2011

Trader Guide for 28-Oct-2011

KST
Nifty Futures 5 min


Nifty Futures 60 min


Nifty Futures EOD


Pivot


Nifty Futures Closed at 5233.00 above pivot and below averages indicating volatile moves possible from opening... on hourly chart KST Indicator is reached Over bought zone wait till fresh cross here to close carried longs and wait for a cross to enter in Shorts.... On EOD chart KST indicator is now again indicating buy on dip will continue till fresh cross on overbought zone..... as of now there is no chance for bears and bears may get good chance very soon with reversal... till sure sell cross on overbought zone on daily chart buy on dips continues...

Is there any chance of correction?

Nifty has broken all important level of 5200 and closed above it, so, one question comes to mind...is it the signal of end of long bear phase or bear is to stay here for sometime more? Let me try to find the answer through my little knowledge.

Strong global cues and some apparently good news have helped NIFTY to shoot up like rocket from 4728 to 52XX.

But a closer look at the chart discloses some interesting setup.
1) -ve divergence is appearing in daily chart.
2) Stochastic and RSI is in overbought zone.
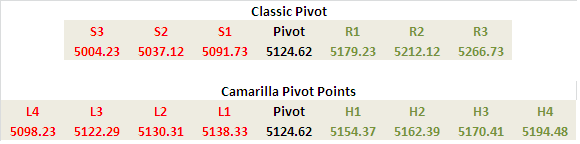
3) High of August 05, 2011 when nifty made huge gap-down of nearly 100 points comes at 5229, upper bollinger band stands at 5258,
4) Recent rally of October 25, 2011 was supported by short covering, not fresh buying by FIIs and DIIs.

So, nifty may get resisted at 5240-5260 zone.

Added to this, fundamentally we are not out of worries.

1. RBI has increased rates for twelve consecutive times which is hurdle for economic growth.
2) Inflation is still a worry for Indian economy although it is hinted that it may come down by few percentage points in December...but in my opinion it will be due to "base effect".
3) Deregulation of savings rate by RBI is a spoiler; because any increase in interest rate will affect the health of banks.

So, bear may stay for sometime now. We must trade cautiously as nifty is trading in neutral zone. We may sell nifty around 5230-5265 with SL 5330 for target of 5000 or lower. Time frame: November expiry.

Sreyoskar Saha

Tuesday, October 25, 2011

Trader Guide for 25-Oct-2011

KST
Nifty Futures 5 min


Nifty Futures 60 min


Nifty Futures EOD


Pivot


Nifty Futures closed at 5105.00 below pivot and averages indicating small hopes for bears on hourly charts KST Indicator again holding sell cross from over bought zone wait for fresh cross on oversold to enter in longs and If market opened with gains sell may take place with support of sell cross on hourly chart... On EOD Charts now looks like volatile move is waiting.... KST Indicator now again attempted buy on overbought zone... due to expiry volatile trend is possible..

Sunday, October 23, 2011

Trader Guide for 24-Oct-2011

KST
Nifty Futures 5 min


Nifty Futures 60 min


Nifty Futures EOD


Pivot


Nifty Futures Closed at 5068 below pivot and averages indicating bears getting control from bulls on hourly chart KST Indicator is holding sell cross from Overbought zone near 0 line and now looking towards oversold zone on wait for fresh cross on oversold zone to enter in longs and close carried shorts if buy cross appears here... On EOD chart KST Indicator attempted sell cross on Over Bought zone wait for clear sell cross here because an whipsaw trade is possible now....
Day trade is ideal for the day....

Thursday, October 20, 2011

Trader Guide for 21-Oct-2011

KST
Nifty Futures 5 min


Nifty Futures 60 min


Nifty Futures EOD


Pivot


Nifty Futures closed at 5105.45 above Pivot and averages indicating bulls grip is strong on nifty now..... on hourly chart KST Indicator is holding buy from oversold zone and now trading near 0 line wait for cross on overbought zone and if we get sell cross on overbought zone we may try intraday shorts with stop loss and wait for fresh cross on oversold zone to enter again in longs... On EOD chart KST indicator is reached overbought zone and till a sell cross here we may continue our trade as buy on dips.....

Wednesday, October 19, 2011

Trader Guide for 20-Oct-2011

KST
Nifty Futures 5 min


Nifty Futures 60 min


Nifty Futures EOD


Pivot


Nifty futures closed at 5146.35 above pivot and averages indicating bulls are enjoying weakness of bears... on Hourly chart KST indicator reached over bought zone and now no sell is visible here till cross here longs are safe and wait for sell cross to enter in intraday shorts with strict stop loss on EOD chart KST Indicator is reaching over bought zone and now here no weakness visible to reverse our trades any sell now is chance to enter in longs.....

Tuesday, October 18, 2011

Trader Guide for 19-Oct-2011

KST
Nifty Futures 5 Min


Nifty Futures 60 Min


Nifty Futures EOD


Pivot

Nifty Futures closed at 5055 above pivot and averages indicating bulls trying to take control from bears..  On hourly chart KST indicator now holding buy cross from oversold zone indicating bulls zone, now wait for fresh cross on over bought zone to short again from high  and close short on lows... or go long with strict stop loss.... on EOD KST Indicator reached Over bought zone now moving together indicating volatile moves are possible... buy on dips continues till fresh sure sell cross here..

Monday, October 17, 2011

Trader Guide for 18-Oct-2011

KST
Nifty Futures 5 Min


Nifty Futures 60 Min


Nifty Futures EOD


Pivot


Nifty Futures Closed at 5122 marginally below pivot and above averages indicating volatile move is waiting.... on hourly chart KST Indicator holding sell cross from bought zone and now trading near 0 line wait to close carried short on fresh cross on oversold and that cross gives us next buying opportunity for longs.  On EOD chart KST indicator looking down from over bought zone... till  sure sell cross on over bought zone buy may continue on every dip... Buy on Dip continues.....

Sunday, October 16, 2011

Trader Guide for 17-Oct-2011

KST
Nifty Futures 5 min


Nifty Futures 60 min


Nifty Futures EOD

 Pivot

Nifty Futures Closed at 5141.50 above  pivot and averages  indicating bulls are looking strong now... on hourly chart till now sell is not visible, wait for cross on over bought zone to close carried longs and  wait to enter in intraday shorts and shorts are not safe till sure sell cross is visible here... on EOD Chart is saying buy on dip continues.......

Thursday, October 13, 2011

Trader Guide for 14-Oct-2011

KST
Nifty Futures 5 min


Nifty Futures 60 min


Nifty Futures EOD


Pivot

Nifty Futures Closed at 5068.90 below Averages and Pivots indicating bearish sentiments after good run... on hourly chart Now KST indicator is holding sell cross from over bought zone.. carried shorts need to close on fresh cross on oversold zone and wait for buying from lows.... On EOD chart KST Indicator now looking downward wait for clear indication to sell on rise till fresh cross on Over bought Zone its a buy on dip kind of market...

Trader Guide for 13-Oct-2011

Nifty Futures 5 min


Nifty Futures 60 min


Nifty Futures EOD


Nifty Futures closed at 5114.85 closed above averages indicating bulls are taken total grip on nifty on charts on hourly chart KST Indicator reached over bought zone we need to close carried longs if sell cross visible here and wait for dip to enter again on long side... on EOD chart we notice KST indicator is reaching overbought  zone very quickly and without interruption and now both lines are not similar we may expect range-bonds or small selling  here... it is times need to align both lines.... buy on dip continues.....

Tuesday, October 11, 2011

Trader Guide for 12-Oct-2011

KST
KST Nifty Futures 5 Min


KST Nifty Futures 60 Min

 KST Nifty Futures EOD
 Pivot


Nifty Futures closed at 4980.10 below pivots and averages indicating again little hope for bear is possible.... on hourly chart KST Indicator is now holding sell cross from over bought zone need to close carried short on fresh cross on Oversold zone and wait for cross on oversold to enter again in longs..... on Daily chart KST Indicator is at 0 line with buy cross from over sold, volatile movement is expected due to 0 line effect so trade for today and trade as trend moves...