KST
Nifty Futures 5 Min
Nifty Futures 60 Min
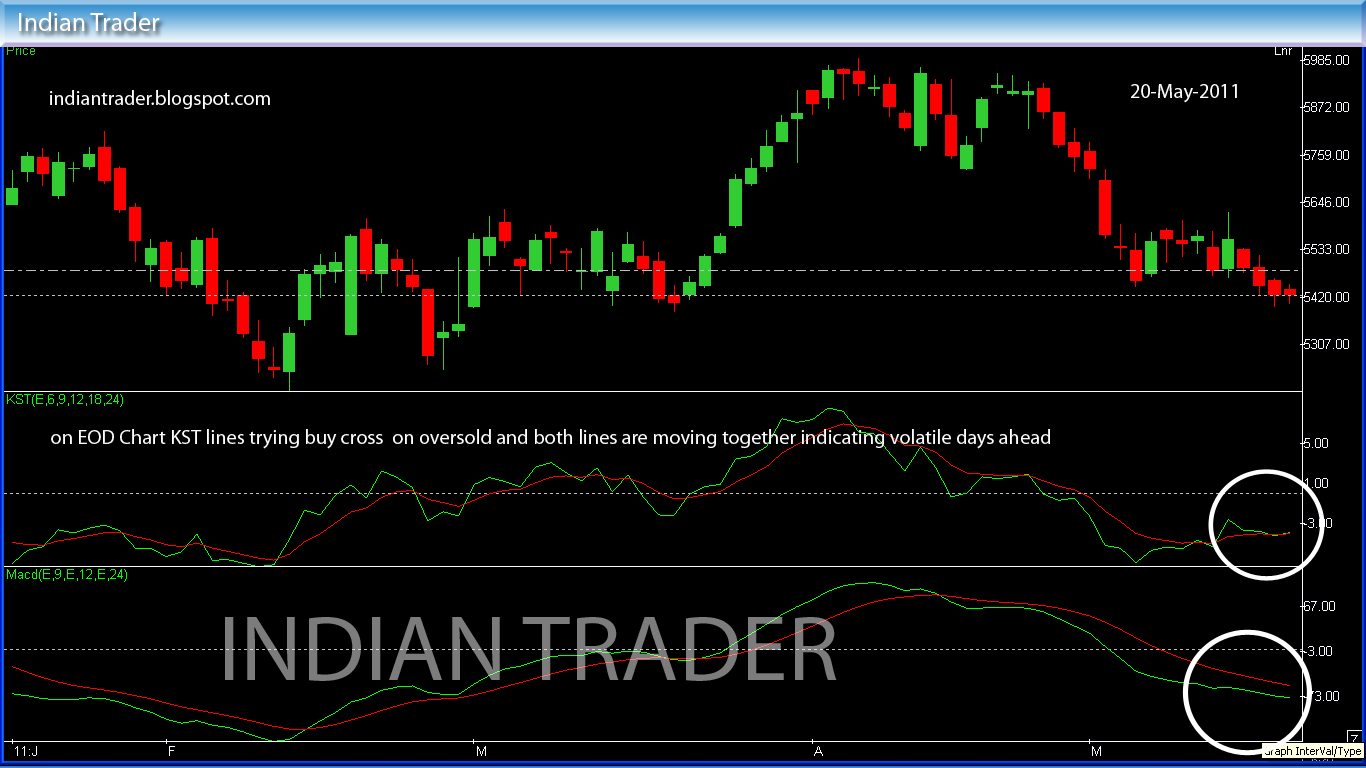
Nifty Futures EOD
Pivot
| Classic Pivot |
| S3 | S2 | S1 | Pivot | R1 | R2 | R3 |
| 5417.12 | 5448.63 | 5500.42 | 5531.93 | 5583.72 | 5615.23 | 5667.02 |
| Camarilla Pivot Points |
| S4 | S3 | S2 | S1 | Pivot | R1 | R2 | R3 | R4 |
| 5506.39 | 5529.29 | 5536.93 | 5544.56 | 5531.93 | 5559.84 | 5567.47 | 5575.11 | 5598.02 |
Nifty Futures Closed at 5552.20 above pivots and averages & if we look at option data call options are trading above averages and put options trading below averages suggesting gains in morning... and if we look at Charts in hourly chart KST lines are now at higher bought zone and any cross here leads to selling for sure... on another side at daily charts KST holding buy cross and now reaching base line ( 0 Line) so we can expect a volatile trade if KST reached baseline and fails to move upside....
KST
Nifty Futures 5 Min
Nifty Futures 60 Min
Nifty Futures EOD
Pivot
| Classic Pivot |
| S3 | S2 | S1 | Pivot | R1 | R2 | R3 |
| 5383.67 | 5412.33 | 5439.67 | 5468.33 | 5495.67 | 5524.33 | 5551.67 |
| Camarilla Pivot Points |
| S4 | S3 | S2 | S1 | Pivot | R1 | R2 | R3 | R4 |
| 5436.20 | 5451.60 | 5456.73 | 5461.87 | 5468.33 | 5472.13 | 5477.27 | 5482.40 | 5497.80 |
Nifty Futures Closed at 5467 below pivot and marginally below averages now its tough to decide where market will move... if we look at options Call options are Closed below averages and Put Options are Closed above averages If we look at charts in hourly chart KST lines crossed on overbought and indicating selling for sure........ For buying we may need to wait for oversold zone again.... on EOD charts KST Lines are reaching base line (0 line) and nifty holds buy cross at over bought zone it is good thing for bulls any selling to be used to invest till EOD holds Buy cross....
KST
Nifty Futures 5 Min
Nifty Futures 60 Min
Nifty Futures EOD
Pivot
| Classic Pivot |
| S3 | S2 | S1 | Pivot | R1 | R2 | R3 |
| 5363.67 | 5389.33 | 5430.67 | 5456.33 | 5497.67 | 5523.33 | 5564.67 |
| Camarilla Pivot Points |
| S4 | S3 | S2 | S1 | Pivot | R1 | R2 | R3 | R4 |
| 5435.15 | 5453.58 | 5459.72 | 5465.86 | 5456.33 | 5478.14 | 5484.28 | 5490.43 | 5508.85 |
Nifty Futures Closed at 5472 above average and pivot and option data supporting up-move on opening as Call option trading above averages and Put options are trading below averages... if we look at KST charts in Hourly charts KST lines trading at overbought zone any cross here leads to selling and if we look at EOD chart if any sell is here that is a chance to enter in longs as buy on dip...
KST
Nifty Futures 5 Min
Nifty Futures 60 Min
Nifty Futures EOD
Pivots
| Classic Pivot |
| S3 | S2 | S1 | Pivot | R1 | R2 | R3 |
| 5302.02 | 5325.98 | 5360.97 | 5384.93 | 5419.92 | 5443.88 | 5478.87 |
| Camarilla Pivot Points |
| S4 | S3 | S2 | S1 | Pivot | R1 | R2 | R3 | R4 |
| 5363.53 | 5379.74 | 5385.14 | 5390.55 | 5384.93 | 5401.35 | 5406.76 | 5412.16 | 5428.37 |
Nifty Futures (June) Closed at 5395.95 above pivots and averages... option data too supporting up-move Option data suggesting strong sentiments continues as call options are trading above averages and put options are trading below averages....
if we look at KST Charts in Hourly chart KST lines reached Overbought Zone and after a good start selling may take place and if we look at EOD charts KST Lines are crossed at Oversold and holding buy cross suggesting up-move..... need to trade according to pivot levels....
[edit]
KST
KST
Nifty Futures 5 Min
Nifty Futures 60 Min
Nifty Futures EOD
Pivots
| Classic Pivot |
| S3 | S2 | S1 | Pivot | R1 | R2 | R3 |
| 5280.12 | 5304.33 | 5326.17 | 5350.38 | 5372.22 | 5396.43 | 5418.27 |
| Camarilla Pivot Points |
| S4 | S3 | S2 | S1 | Pivot | R1 | R2 | R3 | R4 |
| 5322.67 | 5335.34 | 5339.56 | 5343.78 | 5350.38 | 5352.22 | 5356.44 | 5360.66 | 5373.33 |
Nifty Futures Closed at 5348 above pivots and below averages and if we look at options except valuable 5300 call other calls are trading below averages and put options are trading below averages.... suggesting volatile sentiments continues.... if we look at KST charts hourly chart holding buy cross if this cross fails to hold then we can expect a selling pressure on nifty other wise good day for buy on expiry at lower levels and If we look at EOD its again indicating Selling if both charts able to hold sell signal at least for 5 min Nifty may see correction other wise nifty may trade volatile and repeat today's sentiments....
[edit]
KST
Nifty Futures 5 Min
Nifty Futures 60 Min
Nifty Futures EOD
Piviots
| Classic Pivot |
| S3 | S2 | S1 | Pivot | R1 | R2 | R3 |
| 5305.53 | 5332.77 | 5363.33 | 5390.57 | 5421.13 | 5448.37 | 5478.93 |
| Camarilla Pivot Points |
| S4 | S3 | S2 | S1 | Pivot | R1 | R2 | R3 | R4 |
| 5362.11 | 5378.00 | 5383.30 | 5388.60 | 5390.57 | 5399.20 | 5404.50 | 5409.79 | 5425.69 |
Nifty Futures Closed at 5393.90 marginally above average and pivot suggesting Nifty will try another attempt for gains and options are not in mood of supporting up moves 5300 call is only one strike that supporting up-moves and all other calls are on bearish side and if we look at put options... all put options (excluding OTM Options) are traded below averages supporting up moves and heavy volatility is suspected due to expiry heat....
If we look at charts, as on Hourly chart KST lines are trying to reach Base Line (0 line) any cross from Overbought zone is leads selling if fails to hold this buy cross.... Nifty may again face heavy selling with support of EOD Cross.... now on EOD its neither on sell or buy now looking like waiting for judgement... like Non-Aligned Movement......
KST
Nifty Futures 5 Min
Nifty Futures 60 Min
Nifty Futures EOD
Pivots
| Classic Pivot |
| S3 | S2 | S1 | Pivot | R1 | R2 | R3 |
| 5276.05 | 5320.40 | 5351.20 | 5395.55 | 5426.35 | 5470.70 | 5501.50 |
| Camarilla Pivot Points |
| S4 | S3 | S2 | S1 | Pivot | R1 | R2 | R3 | R4 |
| 5340.67 | 5361.33 | 5368.22 | 5375.11 | 5395.55 | 5388.89 | 5395.78 | 5402.67 | 5423.33 |
Nifty Futures closed at 5382.00 below averages and pivots suggesting market may witness more weakness... Call options are traded below averages and put put options are trading above averages good for stay in shorts.... If we look at KST charts in hourly chart KST lines reached oversold and any cross here leads to buying till buy cross we may remain in shorts if we look at EOD Chart KST lines are again on sell mode and suggesting any rise will convert in sell from every high
KST
Nifty Futures 5 Min
Nifty Futures 60 Min
Nifty Futures EOD
Pivot
| Pivot |
| S3 | S2 | S1 | Pivot | R1 | R2 | R3 |
| 5337.47 | 5383.13 | 5431.07 | 5476.73 | 5524.67 | 5570.33 | 5618.27 |
| Camarilla Pivot Points |
| S4 | S3 | S2 | S1 | Pivot | R1 | R2 | R3 | R4 |
| 5427.52 | 5453.26 | 5461.84 | 5470.42 | 5476.73 | 5487.58 | 5496.16 | 5504.74 | 5530.48 |
Nifty futures closed at 5479 above pivot and below averages suggesting volatile trade ahead and if we look at options put options are traded above averages and call options are trading below averages suggesting downward sentiment still remains. if we look at charts in hourly chart KST indicators are in overbought and trying to move downward if cross happens here it may lead to sure sell and EOD charts indicating volatile trades because KST lines are failed to retain previous buy cross.... now both lines again started to move together... any buy will convert in sell after a good start.. buy for 5490-5520-5530 from lows and sell for 5460-5450-5420 from high 5420 working as good suport for nifty if nifty fails to hold 5420 then we surely get 5350-5330 on upper side nifty must hold and trade above 5480 then only we can see next targets otherwise its a good selling points we will get from every new highs....
[edit]
KST
Nifty Futures 5 Min
Nifty Futures 60 Min
Nifty Futures EOD
Pivots
| Pivot |
| S3 | S2 | S1 | Pivot | R1 | R2 | R3 |
| 5360.98 | 5382.72 | 5408.33 | 5430.07 | 5455.68 | 5477.42 | 5503.03 |
| Camarilla Pivot Points |
| S4 | S3 | S2 | S1 | Pivot | R1 | R2 | R3 | R4 |
| 5407.91 | 5420.93 | 5425.27 | 5429.61 | 5430.07 | 5438.29 | 5442.63 | 5446.97 | 5459.99 |
Nifty Futures closed at 5433.95 above pivot and averages.. and near month call options are trading above averages and put options are below averages suggesting a strong sentiment still remains in bearish trend... nearly one point increase is notable point for pivots today Yesterdays pivot is 5429.38 and now today's pivot is at 5430.07 on upper side nifty need to hold 5435 for a target of 5450-5470 and we may get selling at 5450..... on selling side nifty needs to loose some points till 5410 and this will take us to 5400-5380-5360 but there is a big hurdle at 5420 it may leading nifty now... If we look at KST charts daily chart is currently trading in Oversold zone and we may get chance for if KST lines are reached overbought and sure cross is happens from there... on EOD.. KST suggesting volatile trend and now failed sell turned in to buy signal if this cross remains its a buy for next trend...
KST
Nifty Futures 5 Min
Nifty Futures 60 Min
Nifty Futures EOD
Pivots
| Classic Pivot |
| S3 | S2 | S1 | Pivot | R1 | R2 | R3 |
| 5329.27 | 5363.43 | 5395.22 | 5429.38 | 5461.17 | 5495.33 | 5527.12 |
| Camarilla Pivot Points |
| S4 | S3 | S2 | S1 | Pivot | R1 | R2 | R3 | R4 |
| 5390.73 | 5408.86 | 5414.91 | 5420.95 | 5429.38 | 5433.05 | 5439.09 | 5445.14 | 5463.27 |
Nifty futures closed at 5425 closed below averages and pivot suggesting we may remain on short below 5429 for target of 5420-5390-5350 and need to buy for 5435-5460-5470 if we look at options put options are trading below averages and call options are above averages suggesting market may trade volatile.... If we look at charts 60 min chart trying cross on over sold if it happens it may lead to selling otherwise better for intraday longs... on EOD KST lines crossed on Oversold for selling side and if this cross continues selling may lead to 5300 and below.. above 5430 bulls may try to recover and selling may continue from 5450..... for bull phase nifty may need to stay above 5450 for gains of 5500-5550 on bear side nifty need to loose 20 points for 5380-5350....
[edit]
KST
Nifty Futures 5 Min
Nifty Futures 60 Min
Nifty Futures EOD
PIVOT
| Classic Pivot |
| S3 | S2 | S1 | Pivot | R1 | R2 | R3 |
| 5308.78 | 5365.67 | 5407.83 | 5464.72 | 5506.88 | 5563.77 | 5605.93 |
| Camarilla Pivot Points |
| S4 | S3 | S2 | S1 | Pivot | R1 | R2 | R3 | R4 |
| 5395.52 | 5422.76 | 5431.84 | 5440.92 | 5464.72 | 5459.08 | 5468.16 | 5477.24 | 5504.48 |
Nifty Futures closed at 5450.00 below pivot and averages suggesting downward trend remains... buy for 5459-5560 from low and sell for 5430-5400-5390. if we look at KST charts, hourly chart is now representing volatile day as KST attempting cross on oversold zone any cross here may result in bulls revenge on bears and failed attempt lead to sell for sure.... on EOD its now fearlessly moving together on oversold... and now supporting both sentiments...
[edit]
KST
Nifty Futures 5 Min
Nifty Futures 60 Min
Nifty Futures EOD
Pivot
| Classic Pivot |
| S3 | S2 | S1 | Pivot | R1 | R2 | R3 |
| 5405.85 | 5441.60 | 5465.85 | 5501.60 | 5525.85 | 5561.60 | 5585.85 |
| Camarilla Pivot Points |
| S4 | S3 | S2 | S1 | Pivot | R1 | R2 | R3 | R4 |
| 5457.10 | 5473.60 | 5479.10 | 5484.60 | 5501.60 | 5495.60 | 5501.10 | 5506.60 | 5523.10 |
Nifty futures closed at 5490.10 below averages and average price and if we look at options... Put options are trading above averages and call options are below averages suggesting we may face selling again if market gains... above 5530 bulls may try to take control and 5530 may become important support, below 5530 nifty remains weak... for bull phase nifty needs to hold and trade above 5580...
If we look at KST charts hourly chart... there is gap for cross.. we remain short till cross happens here and if we look at EOD its again on selling side... any rise may easily get erased so need to remain on short till next cross...


